
AI Agent Tracing: What Each Step Should Record
When an AI agent gets an answer wrong, a step-by-step record called a trace shows which step failed.
 Jeet Adeshara11 min read
Key takeaways
- AI agent tracing records every step an agent takes on one request: each model call, each tool call with what was sent and what came back, the time, the tokens and any error.
- A trace is the whole journey of one request. A span is one step in it. Spans nest, so you can see which step called which.
- Record the step that failed, not only the steps that worked. A failed step should keep what was sent to the model and any partial reply.
- OpenTelemetry's conventions say not to record prompts and replies by default. In production, store them separately with tighter access, unless the trace store itself meets your privacy rules.
- You don't need to keep every trace. Keep every trace with an error, and a sample of the rest once volume grows.
Say a customer asks your support agent when their parcel will arrive. The agent replies: "Tuesday 4 November." The parcel arrives a week later, and the customer is not happy.
You look up the conversation. You can see the question and the answer. You can't see what happened in between. The agent looked up the order, called the courier's system and wrote a reply. One of those steps went wrong, and the conversation alone won't tell you which.
That is what AI agent tracing is for: it keeps a step-by-step record of each request, called a trace. This post shows what one looks like, what each step should record, what to keep out of it and how many to keep.
What is AI agent tracing?
AI agent tracing records every step an AI agent takes on one request, as one linked record. Each model call and each tool call is saved with what went in, what came out and how long it took. It also notes the tokens used (the units model providers charge by) and any error. When an answer is wrong, the trace shows which step caused it.
Put simply:
The conversation shows what the agent said. The trace shows how it got there.
Think of a parcel's tracking history: not just "sent" and "delivered", but every scan in between, each with a time and a place. Microsoft's agent tracing overview puts the goal as two questions. "Where did this response come from?" and "Which step introduced an error or latency spike?"
What does an AI agent trace look like?
Two words do most of the work.
- A trace is the whole journey of one request, from the user's message to the final answer. OpenAI's Agents SDK documentation says traces "represent a single end-to-end operation".
- A span is one step in that journey, with a start time and an end time. In the parcel analogy, each scan is a span.
Spans nest. The span for the whole agent run holds a span for each model call. It also holds one for each tool call: the agent asking another system to do something, like look up an order. So you can see which step started which, and how long each took.
Here is the delivery-date request as a trace.
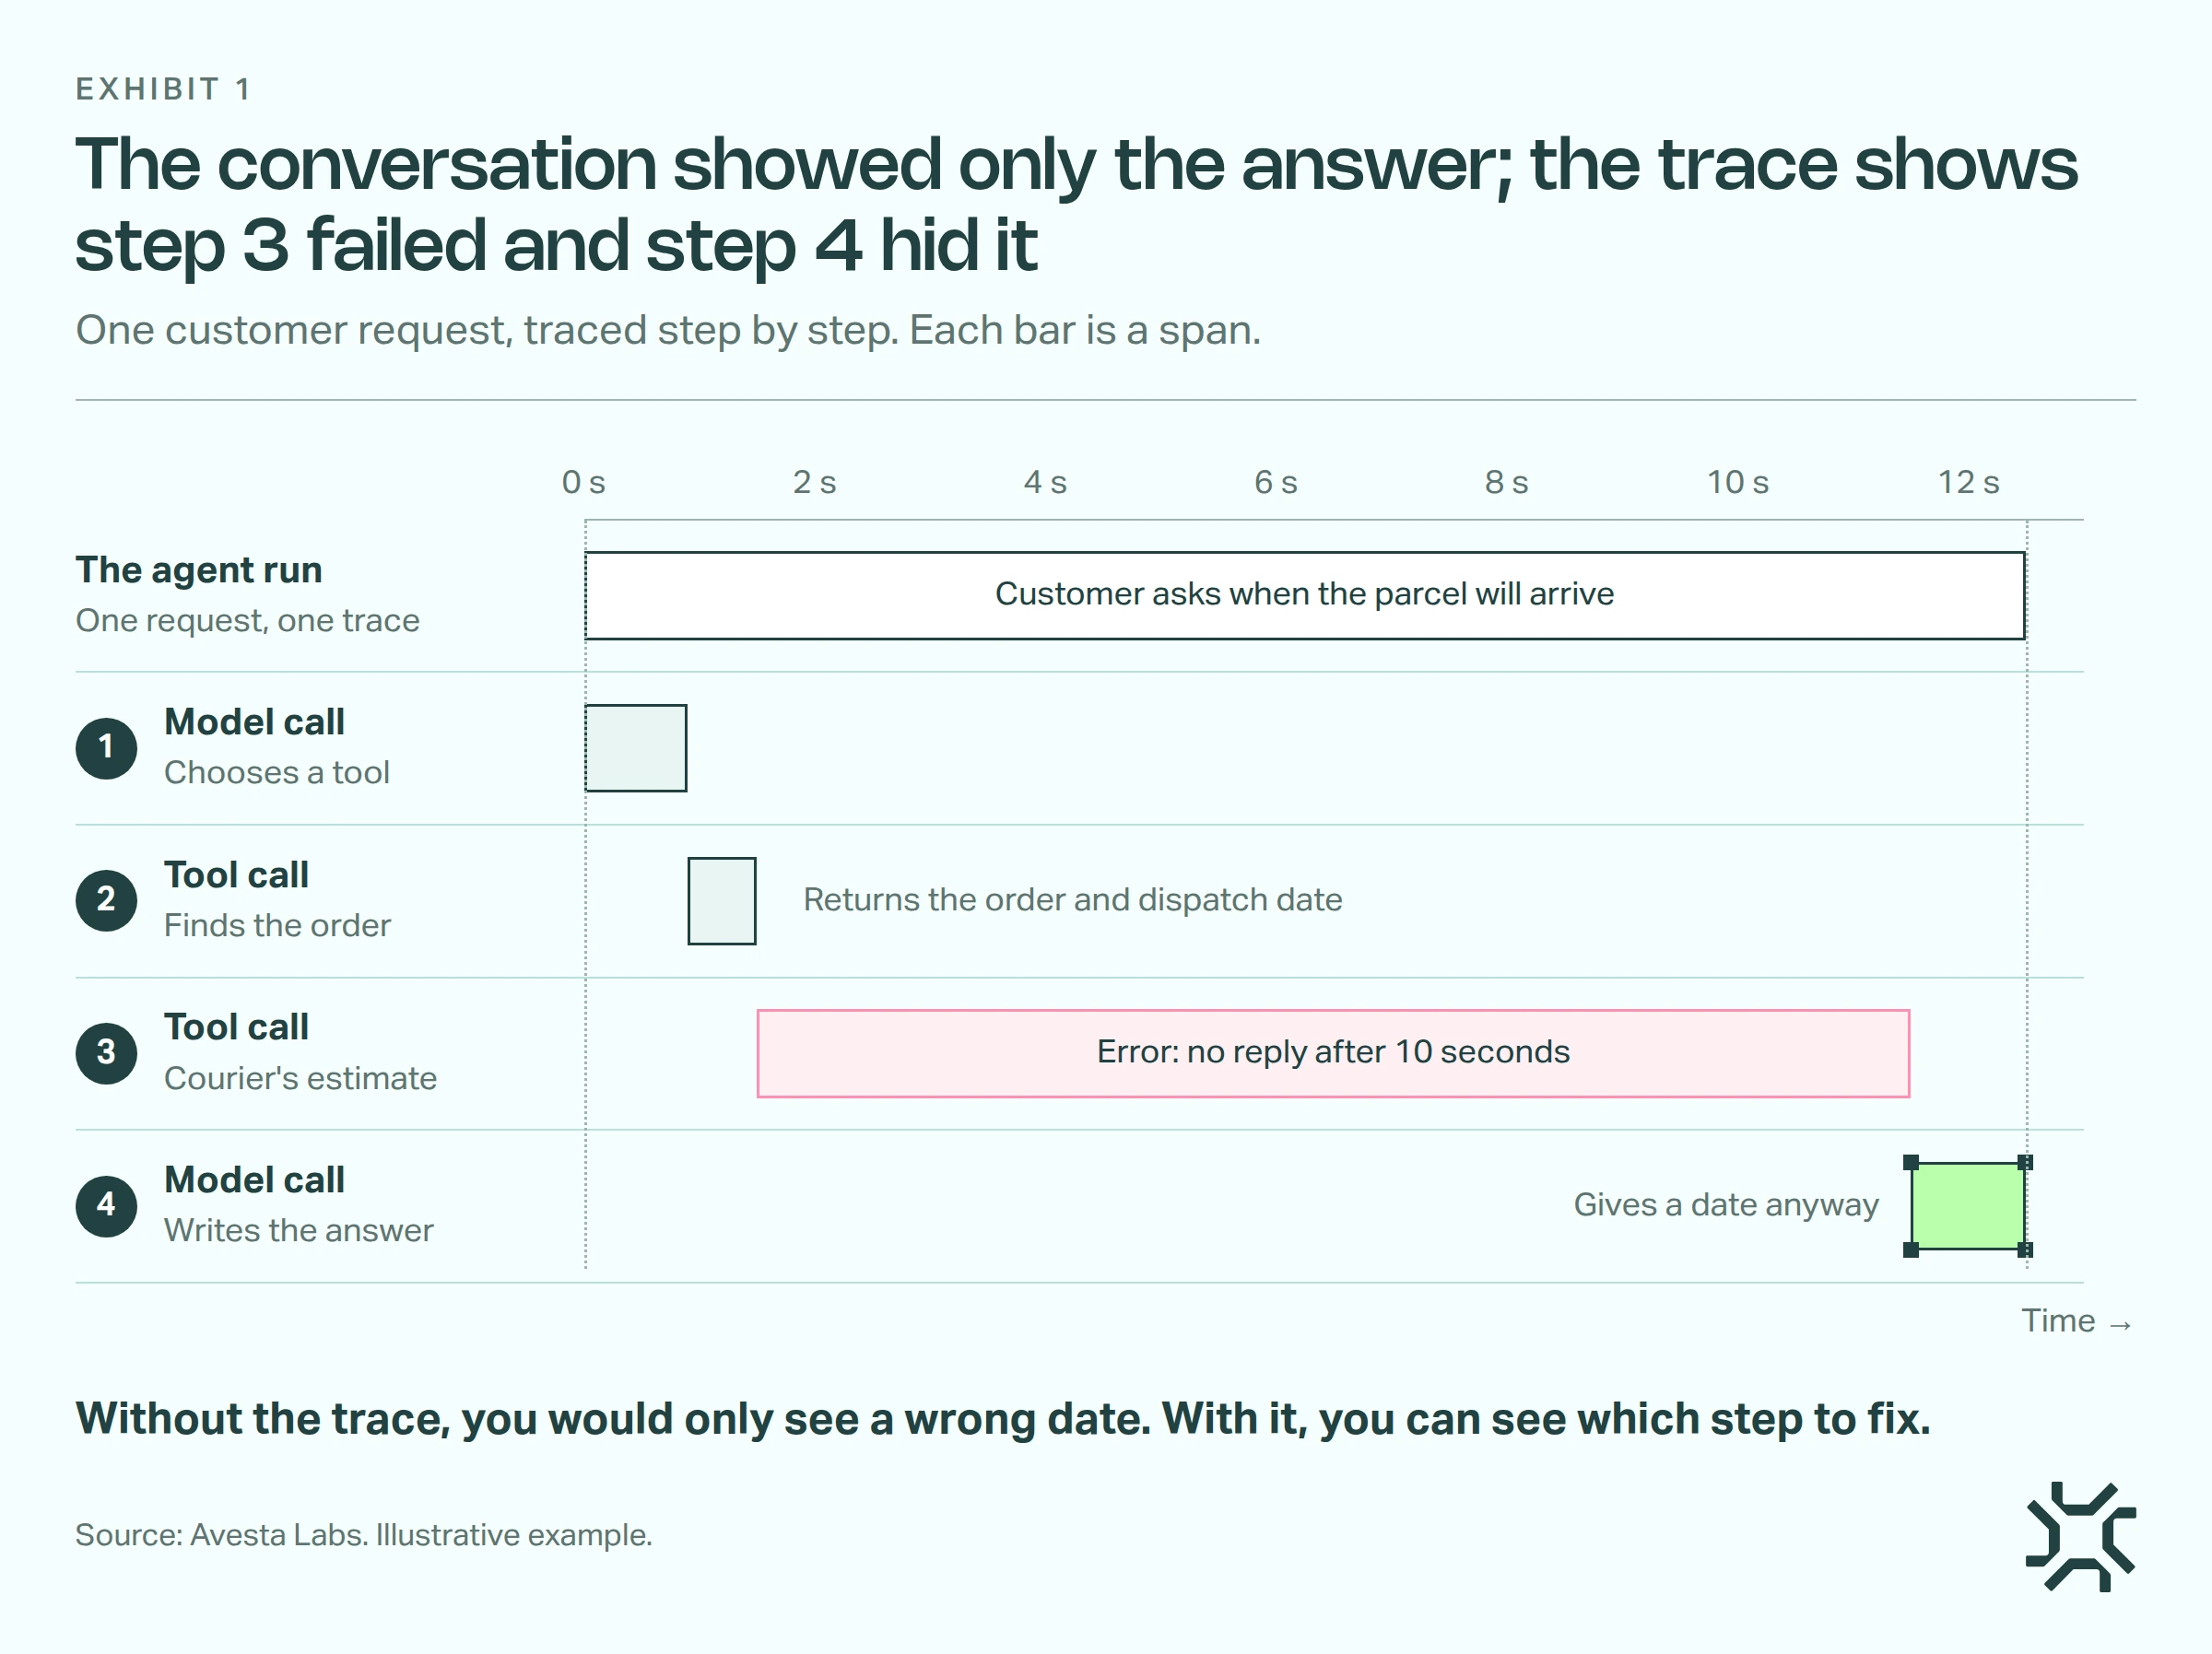
- Model call: choose a tool. The model reads the question and decides to look up the order.
- Tool call: find the order. The order system returns the order and its dispatch date.
- Tool call: get the courier's estimate. The courier's system doesn't reply in time. The span ends with an error.
- Model call: write the answer. The model replies with a date anyway. It had no estimate, so it guessed from the dispatch date.
The conversation showed only the question and step 4's reply. The trace shows that step 3 failed and step 4 hid it. So the fix is clear. Tell the model a missing estimate means "say you don't know". Then add the request to your evaluation set, so the fix is checked on every change. This example is an illustration, not a real case.
What should each step of a trace record?
Each span should answer six questions: what ran, what went in, what came out, how long it took, what it cost and what failed.
| What to record | Example | Why you need it |
|---|---|---|
| Step type and order | Step 3 of 4, a tool call | Shows the sequence and where it broke |
| Start time, end time, duration | 10.0 seconds, then an error | Finds slow steps and timeouts |
| Model name and settings | The model and version used for this step | A model change is a common cause of new behaviour |
| Instructions the model saw | The system prompt, plus any memories added to it | Explains why it chose what it chose |
| Tool name and what was sent | "Courier estimate", order number and postcode | Shows a wrong or missing value |
| What the tool sent back | The reply, or the error message | Shows whether the answer had a basis |
| Tokens used | Input, output and cached tokens | Explains cost, step by step |
| Error details | The error message, plus the status code where you have it | Tells a timeout from a rejected request |
| Links | The conversation, the user, the agent version | Lets you find the trace from a complaint |
OpenTelemetry, an open standard for collecting this kind of data from software, has names for most of these. Its conventions for generative AI include the model requested, the conversation, the tool's name, the details sent to the tool and the result it returned.
Record the step that failed
The step that matters most is often the one that didn't finish. If the model provider returns an error halfway through a reply, a tracer that only saves finished steps records nothing for it.
A trace that only records the steps that worked will hide the one that didn't.
Save a failed step as a span too, with the input that was sent, any partial output and the error message.
How is tracing different from monitoring and an audit log?
These three answer different questions for different people.
| Tracing | Monitoring | Audit log | |
|---|---|---|---|
| The question | Why did this one request go wrong? | Is the agent healthy and helpful overall? | Who did what, under which rule, and who approved it? |
| Who reads it | Engineers | Product owners and engineers | Reviewers, auditors, risk teams |
| What it covers | Every step of one request | Totals and trends across many requests | Each action that changed something |
| Size | Large: full detail of every step | Small: numbers and charts | Small: a few fields per action |
Monitoring tells you something is wrong. Tracing tells you why, one request at a time. An audit log is the short business record, and should point to the trace rather than copy it.
Should a trace record prompts and replies?
This is the biggest choice in tracing, and the defaults disagree.
OpenTelemetry's conventions say model instructions, user messages and outputs "are considered sensitive and are often large in size". So tools "SHOULD NOT capture them by default, but SHOULD provide an option for users to opt in". OpenAI's Agents SDK, as of October 2026, goes the other way: tracing "is enabled by default", and so is its setting to include sensitive data.
Without the text, though, a trace often can't explain the error. So decide on purpose. Drawing on OpenTelemetry and Microsoft, there are three ways to handle it:
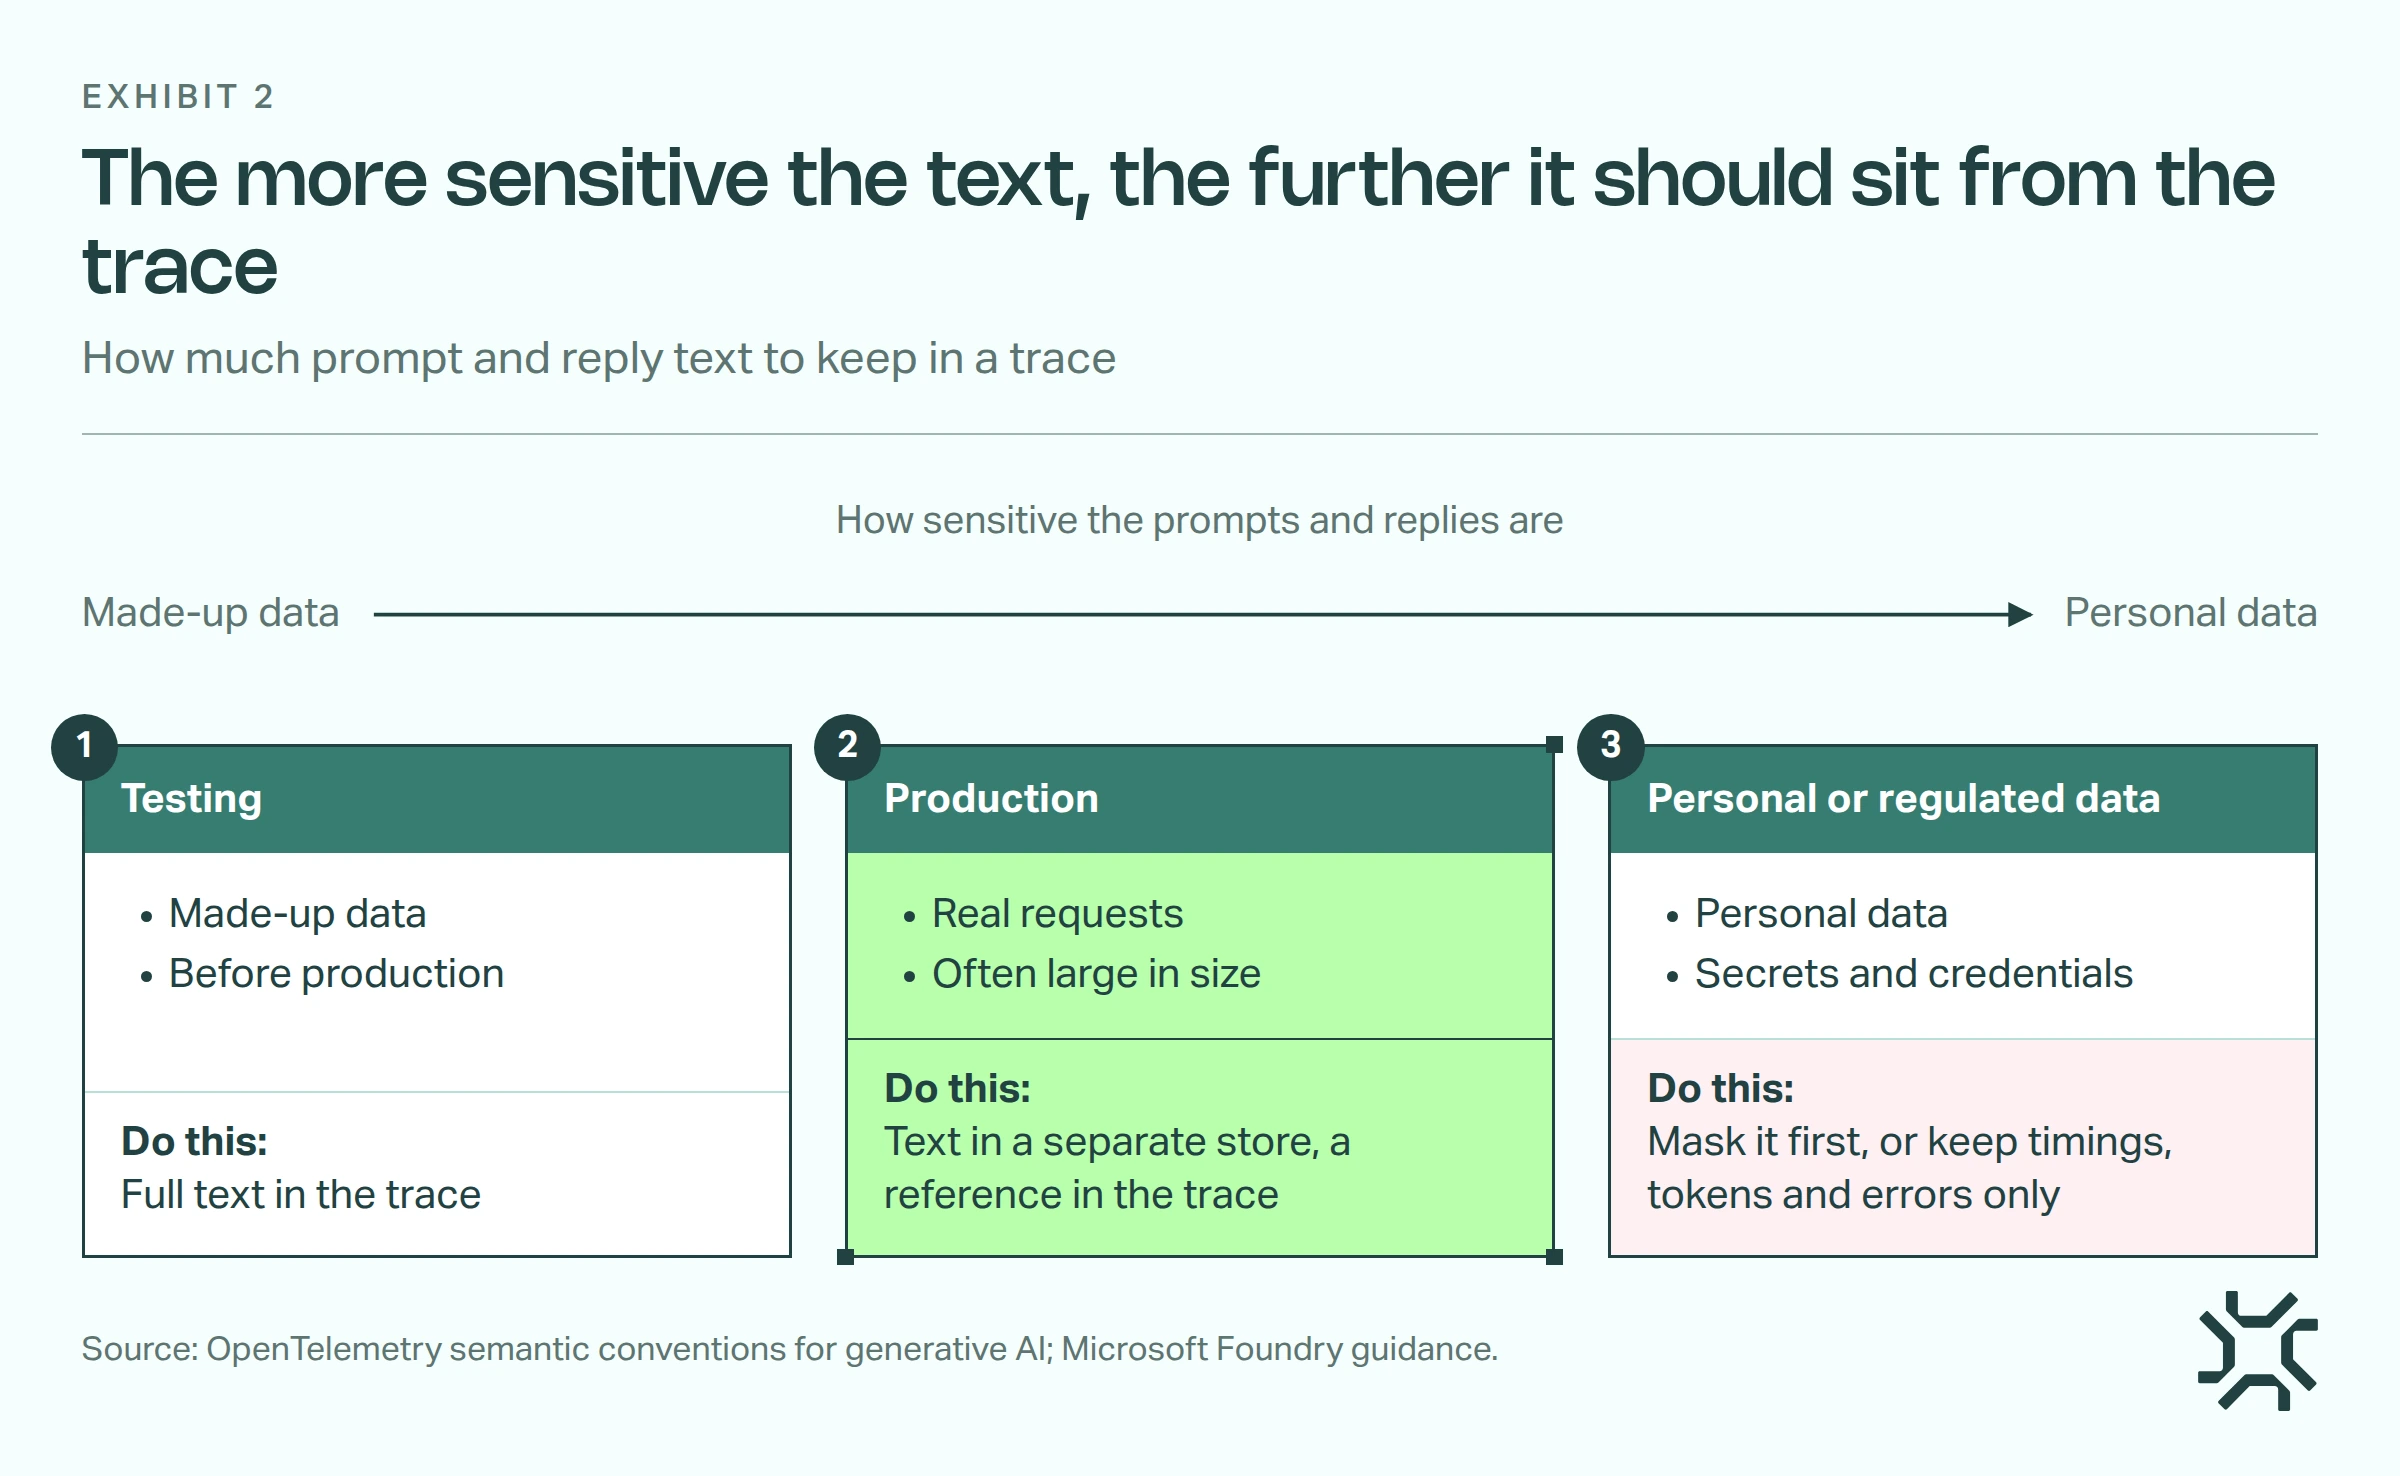
- Testing, with made-up data. Record the full text in the trace. OpenTelemetry says this suits cases where "either privacy regulations do not apply or the telemetry storage complies with them".
- Production. Store the text in a separate store and keep a reference in the trace. OpenTelemetry recommends this because "external storage enables separate access controls": fewer people can read the sensitive part.
- Personal or regulated data. Mask it before it's stored, or keep only timings, tokens and errors. Microsoft's guidance is to "remove or mask personal data, secrets, and credentials" before they reach telemetry. Our post on how to redact PII before it reaches an LLM shows where masking fits.
How does OpenTelemetry trace AI agents?
Many agent tracing tools follow OpenTelemetry's agent conventions, so a trace from one framework can be read in another tool. They name a span for running an agent and a span for each tool it runs. Microsoft lists Foundry, Microsoft Agent Framework, LangChain, LangGraph and the OpenAI Agents SDK as tools that use them.
One caution: Microsoft notes these conventions "have Development status and might change in future releases". If you store traces for a long time, note which version they follow.
Do you need to keep every trace?
Not always. Traces are large, and storage costs money. OpenTelemetry's guide to sampling describes two ways to keep only some.
- Head sampling decides "as early as possible", before the request has finished. It can drop the very trace you needed: "you cannot ensure that all traces with an error within them are sampled with head sampling alone".
- Tail sampling decides after looking at "all or most of the spans within the trace". That lets you keep every trace with an error and a share of the rest.
For most agents the rule is short: keep every trace with an error or a complaint, and a sample of the others. If you "generate very little data (tens of small traces per second or lower)", OpenTelemetry says you may not need sampling at all.
How we trace AI agents in Avesta AgentOS
Here is how this works in Avesta AgentOS, the platform we build and run our AI co-workers on.
The trace exists before the first step
A trace is opened before the model is called, noting which version of the agent is running. When the request finishes, it's updated with the totals: tokens, cost, timings for each tool call and how many steps it took. So if a run fails halfway, its trace still exists, with every step before the failure.
Each step is saved as soon as it finishes, with its full text
Each step is saved as it completes: its type, the tool calls and their results, the full input and output, timings and tokens. The input includes the exact instructions the model saw, with any saved memories added to them, so you can see whether either changed.
That is the first pattern above, full text in the trace, used in production. We chose it because a failed step without its input tells us little. The trade-off is real: each trace is as sensitive as the conversation it came from, so it gets the same protection. Masking personal data before it reaches the model also keeps it out of the trace, though tool results can still hold some.
Failed steps keep what was sent
When the model provider returns an error, we save an error step with the input that was sent, any partial output and the error message. The status code isn't stored as a separate field yet.
Saving a step is a side task. If it fails, the conversation carries on.
If saving a step fails, we log a warning and the conversation continues. Tracing should never be the reason an agent stops.
When is tracing more than you need?
Tracing earns its cost when an agent takes several steps or uses tools.
- A chatbot that makes one model call per question. A log of the question, the answer and the model version is often enough.
- A short prototype with made-up data. Your framework's built-in tracing is fine. Don't build your own yet.
- Text you can't protect. If you can't control who reads stored prompts and replies, record timings, tokens and errors only.
If you only trace one thing, trace the requests that went wrong.
The bottom line
AI agent tracing records every step an agent takes on one request, so a wrong answer leads you to the step that caused it. Record failed steps too, keep sensitive text away from people who don't need it, and keep every trace with an error. For the short record reviewers need, see our AI agent audit log checklist.
If one of your agents gave a wrong answer this morning, how long would it take you to find the step that caused it?
Want to see every step your AI agents take, and fix the wrong ones fast? Avesta AgentOS includes observability, evaluation and guardrails.
Get started: hello@avestalabs.ai
Frequently asked questions
- What is the difference between a trace and a span?
- A trace is the record of one whole request, from the user's message to the agent's final answer. A span is one operation inside it, such as one model call or one tool call, with its own start and end time. Spans can sit inside other spans, which shows which step started which.
- What are agent tracing tools?
- They are tools that collect, store and display traces. Some agent frameworks have tracing built in: OpenAI's Agents SDK turns it on by default. Cloud platforms such as Microsoft Foundry store traces and show them step by step. Many tools follow OpenTelemetry's conventions, so the same trace can be read in more than one place.
- What is the difference between agent tracing and AI agent observability?
- Observability is the wider goal: being able to tell how your agent behaves, how fast it runs and what it costs. Tracing is one part of it, the step-by-step record of single requests. Dashboards and alerts summarise many requests. A trace explains one of them in full.
- Is an agent trace log different from an ordinary log?
- Yes. An ordinary log is a list of separate lines, such as an error or a warning, each written on its own. An agent trace links every step of one request together, in order, with timings, and shows which step started which. You can follow one answer from the question to the reply. With plain log lines, you have to piece that story together yourself.
- Does tracing slow an AI agent down?
- It adds some work to every step, so measure it on your own agent. The bigger risk is a tracing failure stopping the agent. Make saving a step a side task: if saving fails, log a warning and let the conversation carry on. Tracing should never be the reason a customer gets no reply.
Share this article